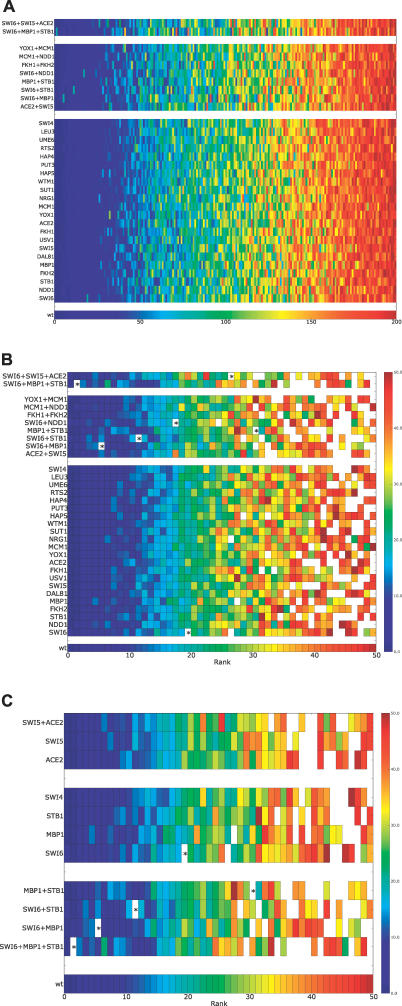
Figure 6. In Silico Network Mutations.
Shown are results from training ANNs missing one or more regulators as indicated on the left margin of each heatmap. Within each heatmap, each cell represents a regulator, the position of the cell along the x-axis of the plot is determined by the mutated network, but the color is indicative of the regulator's rank in the unperturbed network (as shown in Figure 3). The lowest strip shows the rank order color spectrum for the wild-type network.
(A) An overview showing the overall rank stability of the regulators across all mutant networks generated.
(B) A higher resolution view of the top-ranked regulators for each mutant network. Only the top 50 regulators are shown, and the color spectrum is adjusted to only span 1–50. Any regulator that was ranked within the top 50 regulators in a mutant network, but not in the wild-type network, is shown as white. The position of Swi4 in each network is denoted by *.
(C) A zoomed-in version of our mutant network analysis focusing only on networks generated by the top G1 regulators (Swi6, Mbp1, Stb1, Ace2, Swi5, Swi4).

