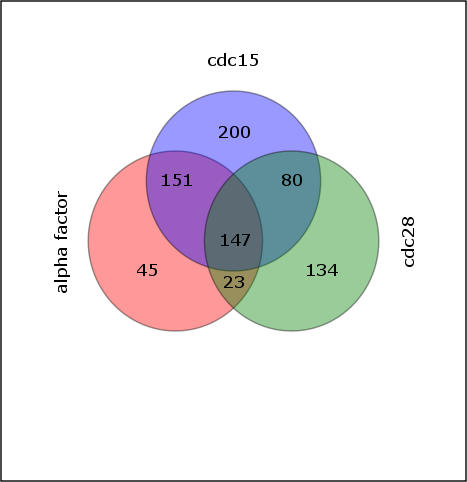
Figure 7. Overlap of Cell Cycle Groups.

Venn Diagram for the total number of genes cycling in each of the three synchronization methods after our filtering and normalization.

Venn Diagram for the total number of genes cycling in each of the three synchronization methods after our filtering and normalization.