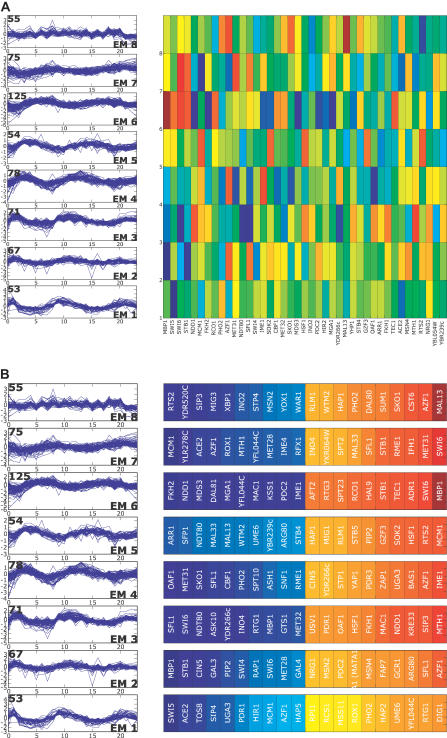
Figure 8. Transcription Factor Rankings by aobANN Weights for Cdc15 Syncrhonized Data.
(A) ANN weights are sorted by the SOS metric as in Figure 3B.
(B) ANN weights from the aob network as in Figure 4 for ANNs trained to predict RNA expression clusters derived from yeast cultures synchronized using Cdc15 TS mutant [1].

