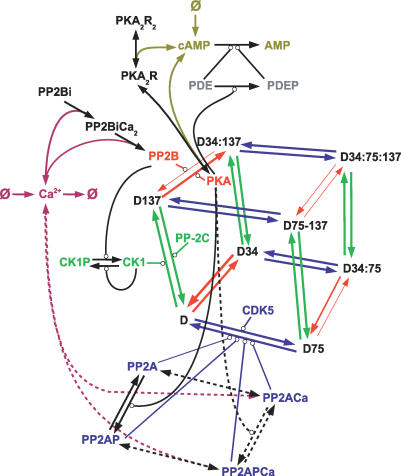
Figure 2. Biochemical Model of DARPP-32 Regulation.
Graphical representation of the models implemented in this study. Arrow-ending lines represent transition, either phosphorylations or binding. Note that the bindings are reversible. Circle-ending lines represent enzymatic reactions. The effects of kinases and phosphatases on DARPP-32 have been represented only once for clarity, but each couple of enzymes effectively acts on every pair of arrows of the same colour. The different thicknesses of the red-arrowed lines represent the catalytic rates for the various DARPP-32 species. Dashed lines represent reactions only present in model B. Colour code of the molecular species is the same as for Figure 1.

