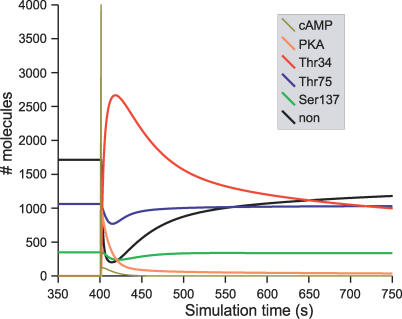
Figure 3. Effect of a Pulse of cAMP on DARPP-32 Phosphorylation.
Time-course of DARPP-32 isoforms after a pulse of cAMP. Brown line represents the number of cAMP molecules. Orange line represents the total number of PKA catalytic subunits not bound to regulatory subunits. DARPP-32 species are represented in black (unphosphorylated), red (D34*), blue (D75*), and green (D137*).

