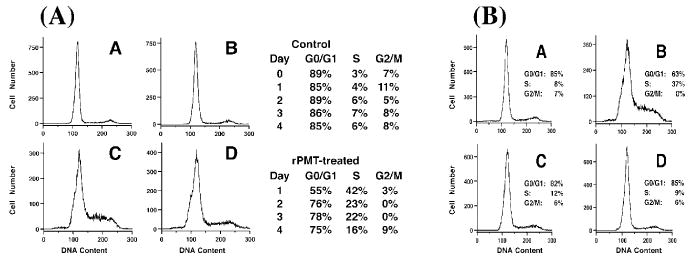
Fig. 1.

Effect of PMT treatment on cell cycle progression in Swiss 3T3 cells. Shown are results from flow cytometry analyses of confluent Swiss 3T3 cells with or without single or multiple PMT treatments. A Representative DNA histograms from a time course of untreated (a and b) or PMT-treated (c and d) cells from day 1 (a and c) and day 4 (b and d). To the right is the summary of the percentages of untreated (top) or PMT-treated (bottom) cells found in G0/G1, S, and G2/M phases of the cell cycle during the time course. B Representative DNA histograms from multiple PMT treatments: (a) untreated cells analyzed on day 5; (b) cells treated with PMT on day 5 and analyzed on day 6; (c) cells treated with PMT on day 0 and analyzed on day 5; (d) cells treated with PMT on day 0 and again on day 5 and analyzed on day 6. The percentages of cells found in G0/G1, S, and G2/M phases of the cell cycle are also shown.(Reprinted with permission from Wilson et al. 2000.)
