
Fig. 2.
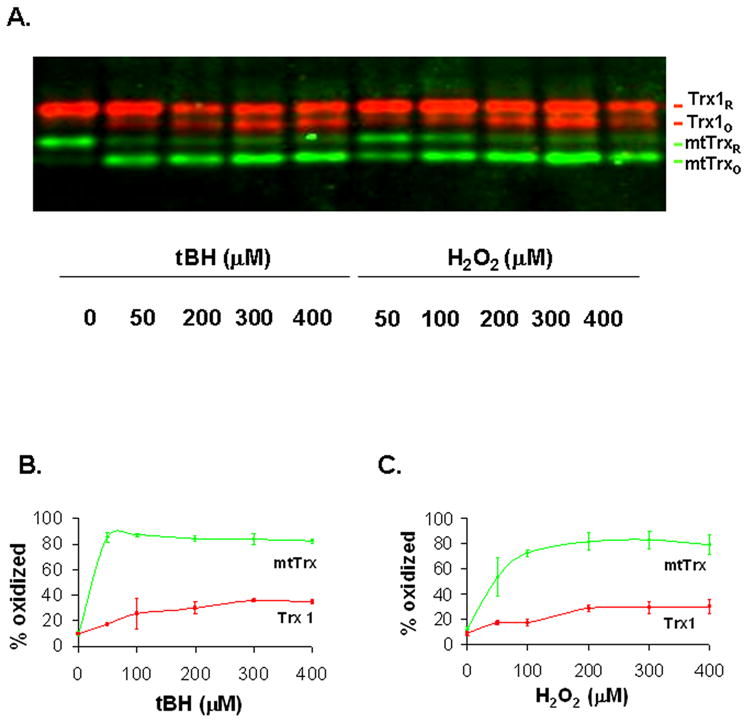
Dose-dependent changes of the redox status of Trx 1 and mtTrx in response to peroxides. (A) The 143 B human osteosarcoma cells were treated with different concentrations of tBH and H2O2 for 10 min. Cells were then harvested and prepared for redox measurement as described in “Materials and Methods”. Data presented are representative of three separate experiments. (B) and (C) Quantification of the Redox Western data after exposure to tBH and H2O2, respectively. The redox status of each protein was presented as the percentage of oxidized proteins. The data presented are the average of three separate experiments (mean ± SEM).