
Fig. 3.
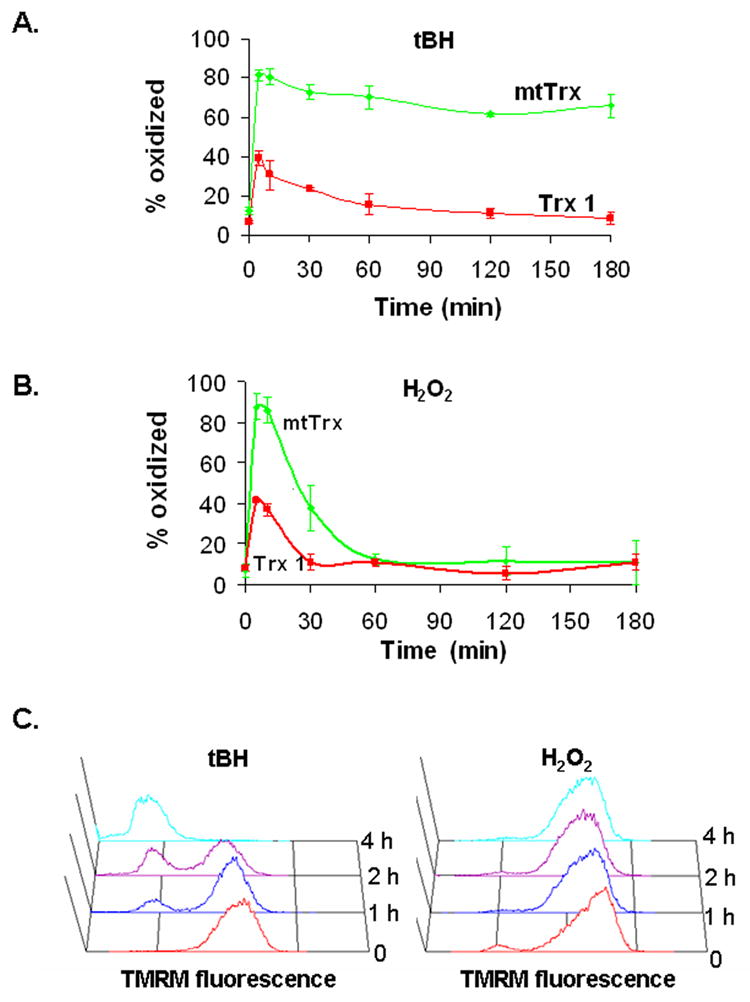
Time courses of peroxide-induced oxidation and mitochondrial depolarization. Cells were treated with either 300 μM of tBH (A) or 300 μM of H2O2 (B) for the indicated times. The redox status is presented as the percentage of the oxidized proteins. Results are the average of four separate experiments (mean ± SEM). (C) The mtΔψ was measured by TMRM staining and flow cytometry. Time-dependent changes in TMRM fluorescence were shown. Data presented are the representative of three separate experiments with similar results.