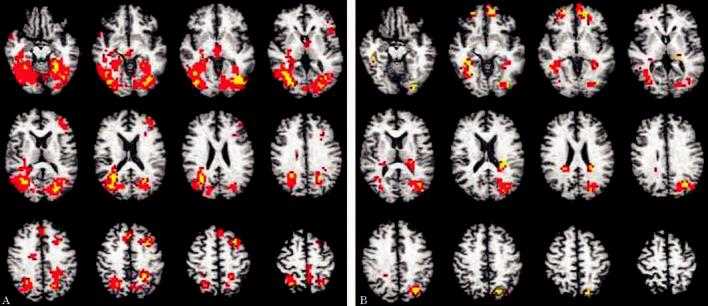
Figure 1.

Magnitude and direction of brain response to the task overlaid onto axial slices of a representative anatomic image in Talairach space (slices span from 12 inferior to 54 superior in 6 mm increments). Activations shown include voxels significant at p < 0.025 that are contained within a cluster of 13 or more voxels. Color scale represents effect sizes for the within-subjects difference between conditions (ENCODE vs REPEAT) as measured by eta2 (red voxels: 0.50 < η2 ≤ 0.75; yellow voxels: 0.76 < η2 & 1.0 [η2 indexes the effect size for the magnitude of the difference between the observed response and 0]). See also table 2 for areas of significant activation. (A) APOE ε4 participants. (B) APOE ε3 participants.
