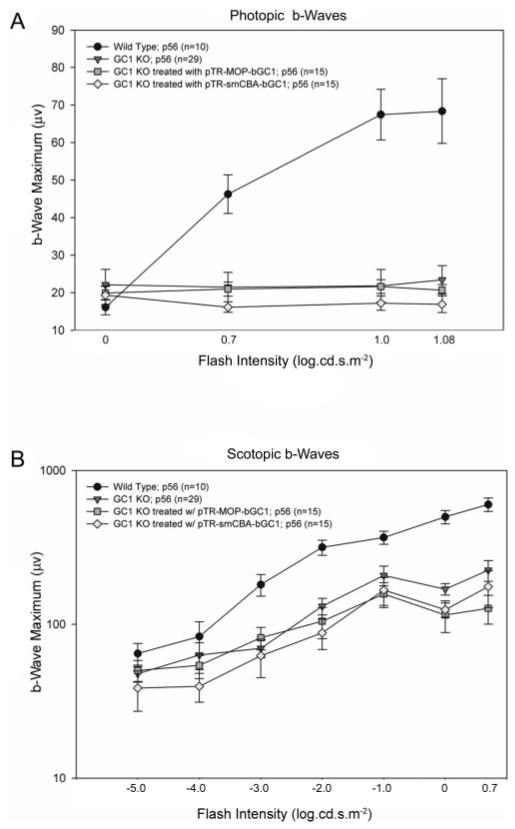
FIGURE 3.

Electrophysiological analyses of AAV-GC1 retinas. (A) Comparisons of cone responses in age-matched (P56) WT (n = 10), GC1 KO (n = 29), pTR-MOP-bGC1– (n = 15) and pTR-smCBA-GC1–(n = 15) treated mice 5 weeks after treatment. Photopic responses were elicited using seven stimulus intensities (−3.0 to 1.08 log cd · s/m2), and the amplitudes of the b-waves of the ERG were measured. No responses were obtained at the three lowest flash intensities and are not plotted. Each point represents the mean ± SEM of the amplitudes of the b-waves recorded for each group at the indicated flash intensity. (B) Comparisons of rod responses in the same age-matched WT, GC1 KO, pTR-MOP-bGC1–, and pTR-smCBA-GC1–treated mice. Scotopic responses were elicited using seven stimulus intensities (−5.0 to 0.7 log cd · s/m2), and the amplitudes of the b-waves of the ERG were measured. Each point represents the mean ± SEM of the amplitudes of the b-waves recorded for each group at the indicated flash intensity. Scotopic responses in AAV-bGC1–treated animals were indistinguishable from those of untreated controls at all flash intensities.
