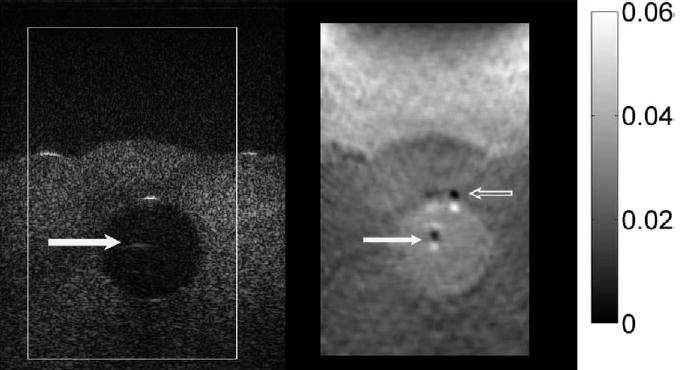
Fig. 15.

B-mode image (left) and elastogram (right) with the Siemens Antares of the 14-mm diameter TM fat sphere. A ghost echo appears near the center of the TM fat sphere in the B-mode image (solid white arrow), and corresponding artifacts appear in the elastogram (solid white arrow). Also, more severe artifacts appear in the elastogram (open arrow) corresponding to the specular reflection at the proximal sphere surface in the B-mode image. Those artifacts are the result of local echo signal decorrelation. The ghost echo in the B-mode image is a reverberation artifact; it is not present when the scan slice is tilted at different angles.
