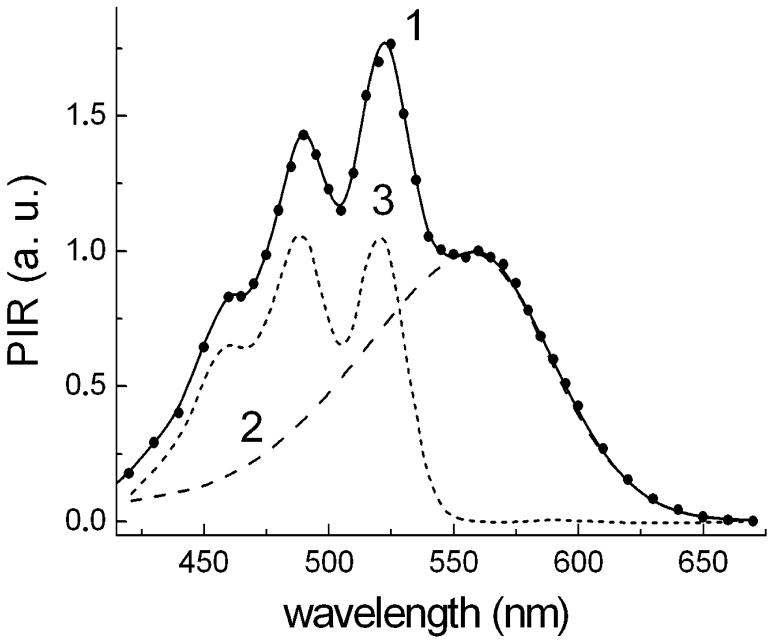
Fig. 3.
A. Action spectrum of light-induced photoinhibition of respiration (PIR) in suspension of S. ruber cells and its components: 1, action spectrum measured with a spectral half-band of 4 nm; the amplitude was normalized to 1 at 560 nm; 2, retinal chromophore component of the action spectrum. At λ > 560 nm it coincided with the action spectrum. This part can be approximated well by a Gaussian band with maximum at 559 nm and half width of 2150 cm-1. The part of the spectrum at λ 560 nm was approximated by a spectrum of bacteriorhodopsin shifted 9 nm to shorter wavelengths. 3, carotenoid component of the action spectrum obtained as a difference “spectrum 1 minus spectrum 2”. This spectrum can be very well approximated by a sum of four Gaussian bands at 522 nm (A=1.03; Δν½ = 860 cm-1), 490 nm (A=1.0, Δν½ = 1110 cm-1), 460 nm (A = 0.62, Δν½ = 1430 cm-1), 432 nm (A = 0.17, Δν½ = 1490 cm-1).

