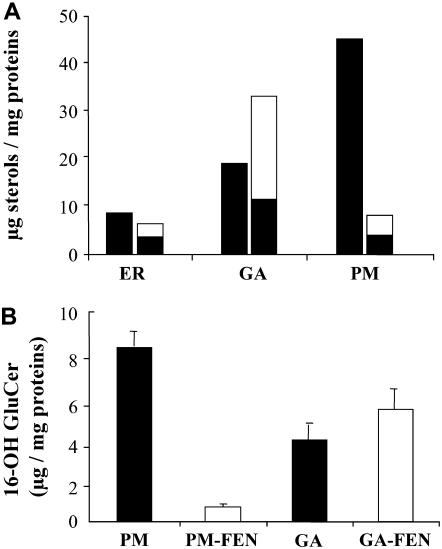
Figure 4.
Effect of FEN (2 mg/L) on sterol and 16-OH GluCer distribution in the membranes of the secretory pathway of leek seedlings. A, Δ5-Sterols in control and FEN-treated seedlings are shown in black. Cyclopropysterols in FEN-treated seedlings are shown in white. For each membrane compartment, the first column corresponds to the control seedlings and the second one to the FEN-treated seedlings. Values in the figure represent one of two representative experiments. B, Amounts of 16-OH GluCer isolated from PM and GA from FEN-treated or untreated plants. Values represent means ± sd of five replicates for PM and PM-FEN and three for GA and GA-FEN. According to the Student's law, the P value for GA and GA-FEN was <0.10.

