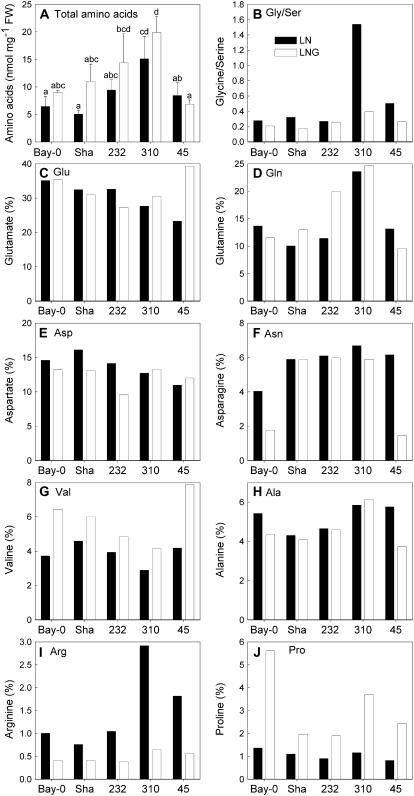
Figure 5.
Effect of Glc on amino acid content during leaf senescence in RIL 45, RIL 232, and RIL 310 with contrasting senescence phenotypes and their parental accessions (Bay-0 and Sha). A, Total amino acid content are means and sd of three to four samples. Different letters indicate statistically different content (ANOVA; P < 0.05). B to J, For individual amino acids, their proportion relative to the total amino acid content is shown. LN (black bars), Plants grown on low-nitrogen medium in the absence of Glc; LNG (white bars), plants grown on low-nitrogen medium with addition of 2% Glc.

