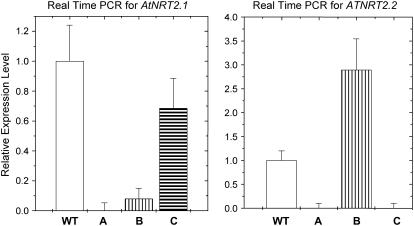
Figure 2.
Real-time PCR expression patterns for AtNRT2.1 and AtNRT2.2 in wild-type (WT), Atnrt2.1-nrt2.2 (A), Atnrt2.1 (B), and Atnrt2.2 (C) plants, respectively. Expression levels of mutants are given relative to wild type (set at 1). Results are the means of two separate experiments using three replicate analyses for each experiment.

