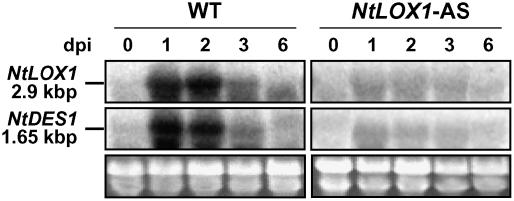
Figure 6.
NtDES1 and NtLOX1 transcriptional profile upon infection. Northern analysis was performed on 20 μg total RNA isolated from roots inoculated with zoospores of Ppn race 0 at the indicated time points. NtLOX1 (2.9 kb; top) and NtDES1 (1.65 kb; middle) transcripts were detected with radiolabeled probes. Bottom image shows ethidium bromide staining of the gel. One representative image out of two independent trials is reported.

