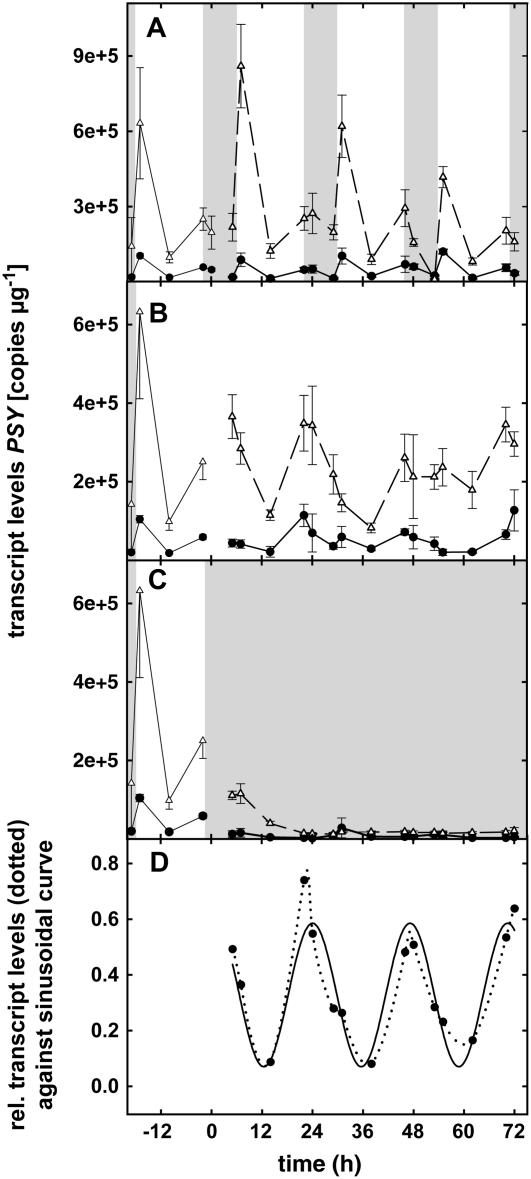
Figure 3.
PcPSY gene expression under LD (16-h light/8-h dark) conditions (A), under LL conditions (B), and under DD conditions (C). In each graph, the two curves represent two independent experiments (n = 3 ± se) and the curves shown in the first 24 h of each graph represent the mean of 3-d expression levels under LD conditions. D, Sinusoidal regression (y = y0 + a sin [2πx/b + c]; with a = 0.2574; b = 23.1706; c = 1.3461; y0 = 0.3279) on relative data under LL conditions (mean of both experiments; adjusted R2 = 0.9695, P < 0.001). Darkness is represented as shaded areas. Transcript levels are related to RNA quantity.

