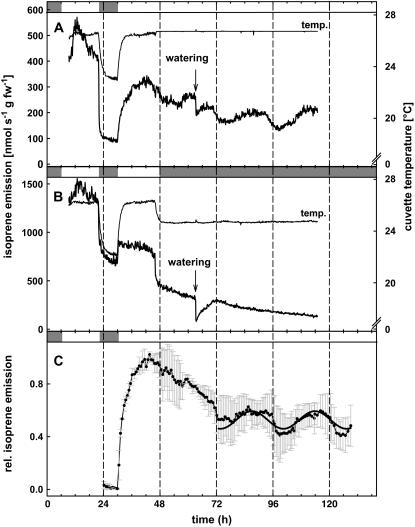
Figure 6.
Isoprene emission from cell-cultured poplars under LL conditions (A) and DD conditions (B). C, Related isoprene emission data under LL conditions (15 min means; n = 3 ± sd) with sinusoidal regression (y = y0 + a sin [2πx/b + c]; with a = 0.0670; b = 26.7854; c = 6.2800; y0 = 0.5269) on related data under LL conditions (mean of both experiments; adjusted R2 = 0.9951, P < 0.001) for the last 2 d. After two day-night cycles, plants were placed either under LL (A) or DD (B; 3-min means). During the third day, water was added to the cuvettes to maintain humidity. The following decrease in emission is indicated. A and B, One experiment out of three replicates. Dark and light periods are presented with gray and white boxes above the figures.

