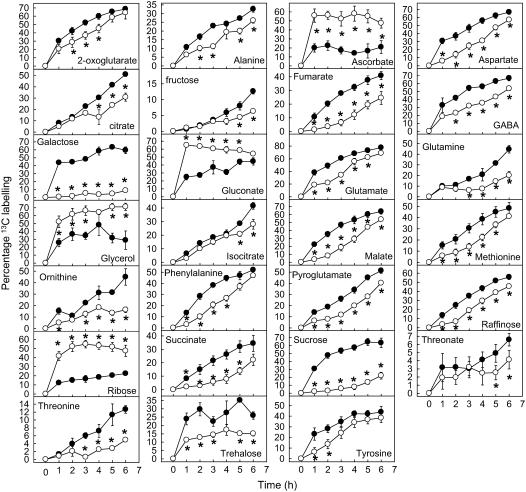
Figure 2.
Time series of 13C-label accumulation showing metabolites with significant differences in labeling following oxidative stress. White symbols are menadione-treated cells and black symbols are control cells. Values are means of four replicates ± sem. The asterisk (*) indicates significantly different to equivalent control point (t test, P < 0.05).

