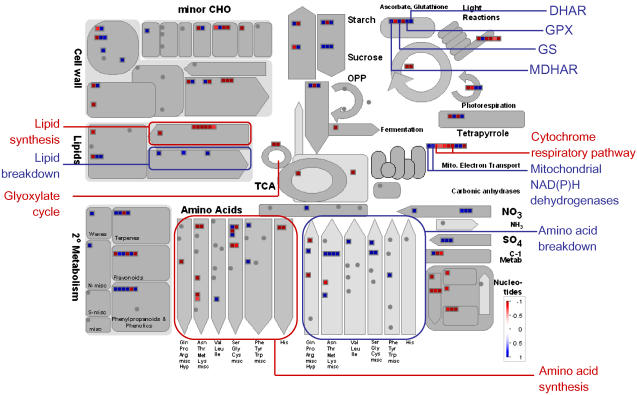
Figure 5.
Metabolic transcripts that are significantly altered after 6 h of oxidative stress. For details of statistical tests see legend to Table I. The abundance ratio (log [2] abundance treatment/control) of significantly altered transcripts (P < 0.05, FDR < 0.1%) are shown using the color scale indicated on the diagram. Key genes are labeled. DHAR, Dehydroascorbate reductase; GPX, glutathione peroxidase; GS, glutathione synthetase; MDHAR, monodehydroascorbate reductase.

