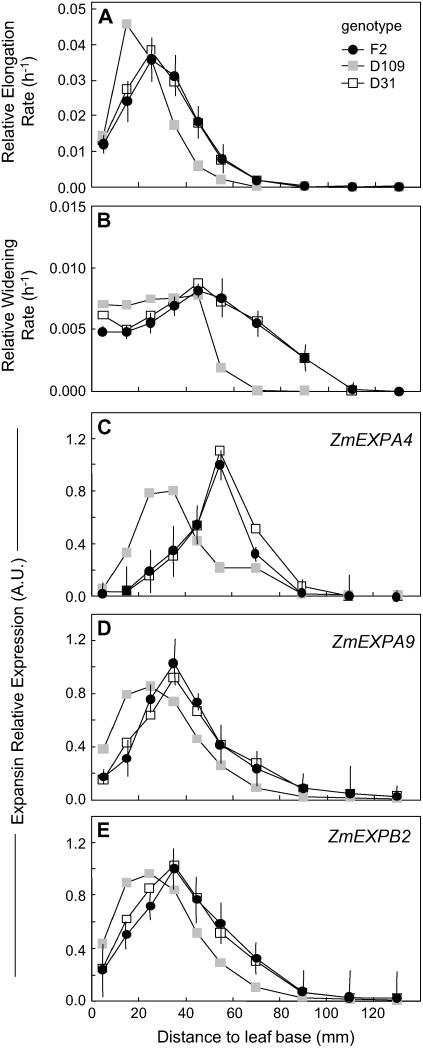
Figure 2.
Comparison of spatial distributions of relative elongation rate (A) and relative widening rate (B) and of expressions of three expansin genes (C, D, and E for ZmEXPA4, ZmEXPA9, and ZmEXPB2, respectively) at the leaf base of well-watered plants from the F2 line (•) or two maize lines with either short (D9 line; gray square) or long (D31 line; □) elongation zones. Maximal expression from the F2 line was set to 1. RER data are means and sds of three replicates of six plants each. RWR data are means and sds of three independent sets of plants. Expression data are means of two technical replicates and two independent samples. Vertical bars only show sd for the F2 line for better legibility. RER and RWR data for F2 plants are the same as those shown in Figure 1, B and C.

