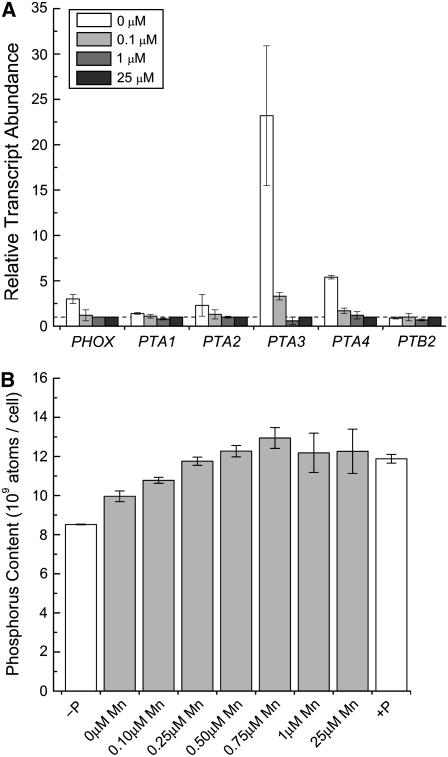
Figure 10.
Mn-deficient cells are phosphorus deficient. A, RNA was isolated from cells grown in TAP medium containing the indicated amounts of Mn2+ supplement. Gene expression was assessed by real-time PCR as described in the legend to Figure 5. The results shown are representative of experimental duplicates. The iron content of the medium (18 and 50 μm) had no impact on the result. B, Phosphorus accumulation was measured by inductively coupled plasma-atomic emission spectroscopy (see “Materials and Methods”) during Mn deficiency (gray bars). Phosphorus-starved (for 24 h) and -replete cultures are included as controls (white bars). Experiments were performed in biological duplicate in strain CC425 and verified in strain CC1021.

