Figure 4.
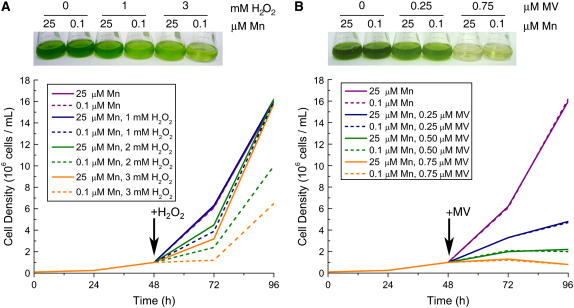
Selective sensitivity of Mn-deficient cells to H2O2. Cells were grown in 0.1-μm supplemental Mn or 25-μm Mn conditions for 2 d. The growth rate of cells in 0.1 μm supplemental Mn is similar to that of cells grown with 25 μm Mn. Cultures were diluted to 1 × 10⁶ cells/mL before the addition of the indicated concentrations of H2O2 (A) or methyl viologen (MV; B). Growth was monitored by counting cells in a hemocytometer (bottom). Cultures were photographed 24 (H2O2) and 48 (MV) h after exposure to the chemical (top). A duplicate experiment is shown in Supplemental Figure S3.

