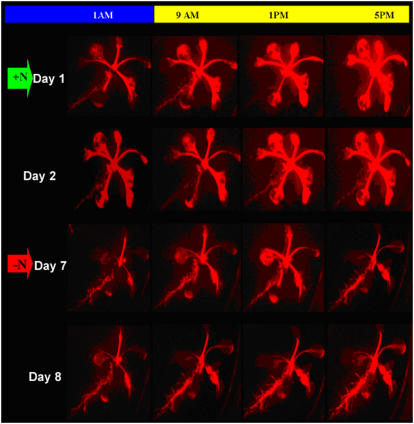
Figure 2.
Grid of LUC images (red) showing the progression of a single AtAmt1.1-driven Gal4-LUC plant line 17 through growth on +N and −N media over the course of 8 d. The bar at the top of the image indicates time during the diurnal cycle (yellow and blue indicate light and dark periods, respectively) at which the images were taken (columns). The top two rows show images of the plant grown on +N medium and the bottom two rows show images of the plant after nitrogen starvation. The plant was initially grown on +N medium for 2 weeks and then shifted to fresh +N medium and imaged for LUC (green arrow, days 1 and 2). The plant was shifted to −N medium after day 2 and allowed to undergo nitrogen starvation for 4 d after which LUC imaging was continued (red arrow, days 7 and 8).

