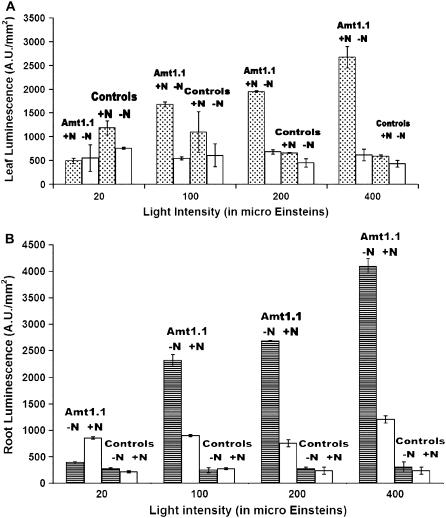
Figure 3.
Quantification of LUC expression in leaves (A) and roots (B) of AtAmt1.1-driven Gal4-LUC line 19-2 (denoted by Amt1.1) grown on +N and −N media in short-day conditions, as indicated, over a range of light intensities. Error bars represent sd (n = 10). Expression profiles of full 35S-driven Gal4 control lines is also shown (denoted by controls). LUC imaging was conducted at the midpoint of the light period.

