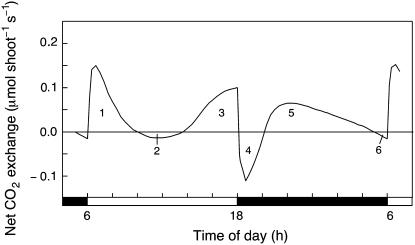
Figure 1.
Diel (24 h) net CO2 exchange pattern of the shoot of a 97-d-old, flowering plant of M. crystallinum grown in hydroponic solution containing 400 mm NaCl. White bar indicates the light period; black bar indicates the dark period. The sum of the areas between the net CO2 exchange trace and the zero line, designated 1 and 3, represents net CO2 uptake during the light period. Area 1 plus area 3 minus area 2 represents net CO2 balance during the light period. Area 5 represents net CO2 uptake during the dark period. Area 5 minus area 4 minus area 6 represents net CO2 balance during the dark period.

