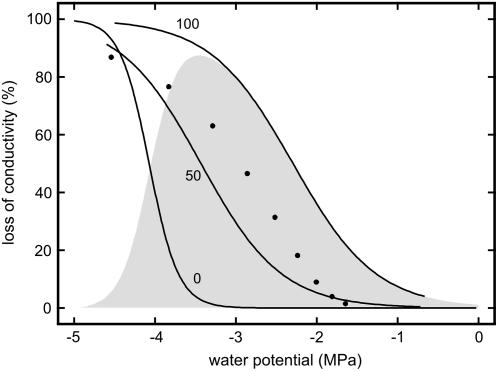
Figure 1.
Loss of conductivity in twigs of P. abies dehydrated to various ψ and exposed to 0, 50, and 100 freeze-thaw cycles (modified after Mayr et al., 2003a). The gray area gives the difference between the treatment with 100 and 0 freeze-thaw cycles, thus showing the effect of the freeze-thaw processes. Black circles indicate the vulnerability to freeze-thaw cycles according to the model of Pittermann and Sperry (2006). Model calculations were based on the tracheid cross-sectional area distribution given in Mayr et al. (2003a).

