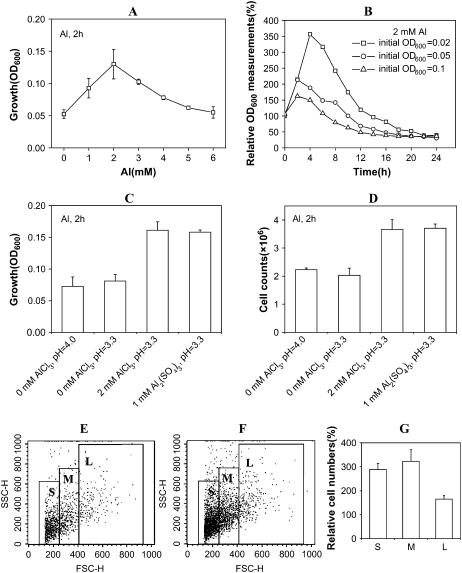
Figure 2.
Effect of Al toxicity on cell division in yeast. A, OD600 measurements of the control cells incubated in SD/Gal-Raf/His medium upon indicated Al levels for 2 h. B, Growth of the control cells with different initial cell densities (OD600 = 0.02, 0.05, and 0.1, respectively) incubated in SD/Gal-Raf/His with 2 mm Al during 24 h. OD600 values were measured at 2-h intervals, and relative OD600 values were calculated as a percentage of corresponding controls. C and D, Comparison of cell growth presented with OD600 values (C) or cell numbers (D) between cells treated with 0 mm AlCl3 (pH 4.0), 0 mm AlCl3 (pH 3.3), 2 mm AlCl3 (pH 3.3), and 1 mm Al2(SO4)3 (pH 3.3) for 2 h. E and F, Cells were treated with no Al (E) or 2 mm Al (F) for 2 h, and then cell numbers with different sizes (S, small; M, middle; L, large) were cytometrically counted. G, Relative cell numbers in Al-treated cells (F) were expressed as a percentage of the untreated control (E). Initial OD600 is 0.05, except for B.

