Figure 4.
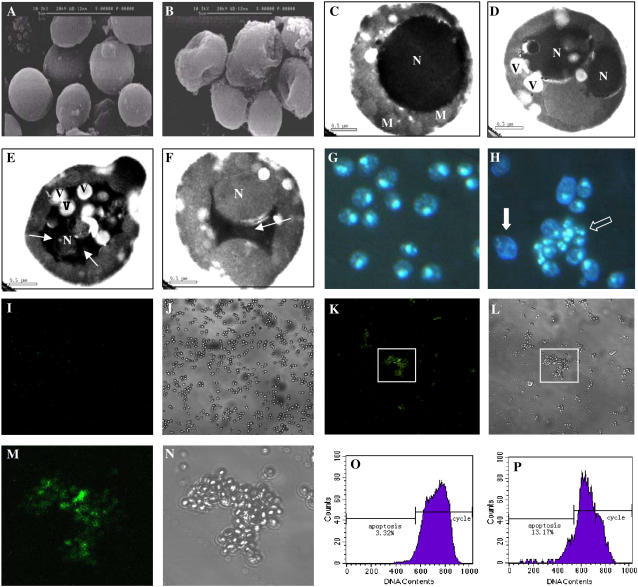
Characterization of Al-induced PCD in yeast. Yeast cells were treated with no Al (A, C, G, I, J, O) and 6 mm (B, D, E, F, H, K, L, M, N, P) Al for 6 h and then harvested for further experiments. A and B, Scanning electron micrographs of the control and Al-treated cells. Bars, 5 μm. C to F, Transmission electron micrographs of control cells and Al-treated cells. Insets, Arrows point to regions of nuclei with marginalized chromatin. Bars, 0.5 μm. N, Nucleus; M, mitochondrion; V, vacuole. G and H, Nuclear fragmentation (black arrows) and DNA degradation (white arrows) shown by DAPI staining. I to N, TUNEL assay. Boxes marked K and L are magnified in M and N using a Zeiss LSM image examiner. Positive TUNEL signals were detected mainly in Al-induced aggregate cells. O and P, Analysis of DNA content by flow cytometry in PI-stained cells.

