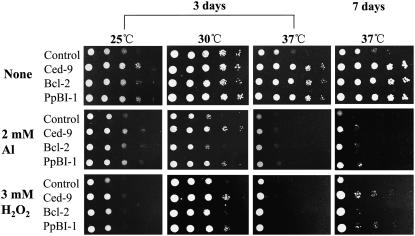
Figure 6.
Sensitivity tests of cells expressing Ced-9, Bcl-2, and PpBI-1 challenged with Al, H2O2, and temperatures. Log-phase cells were diluted at 10-fold series with initial OD600 2.5, and then 6 μL of each dilution were spotted on SD/Gal-Raf/His plates containing Al or H2O2 at indicated temperatures. Photos were taken after 3 or 7 d of incubation.

