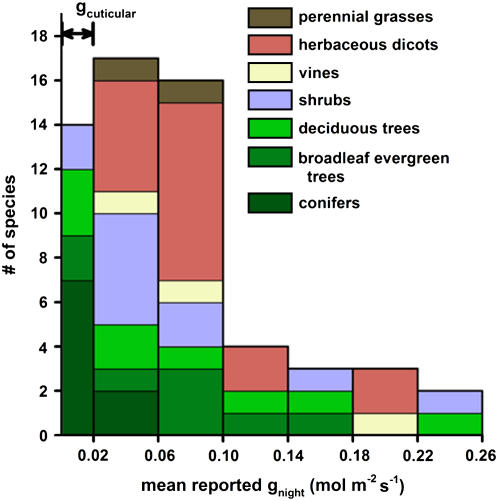
Figure 1.
Histogram summarizing reported gnight in species among different plant functional groups. For each species, gnight was averaged from all reported values with units in mol m−2 s−1 presented in Supplemental Table S1 and thus represents a mixture of field and greenhouse studies. The black two-headed arrow at the top left of the graph represents the range for reported gcuticular taken from many species, and reported gnight within this range may be largely due to gcuticular rather than gstomatal. A complete listing of species with references is provided in Supplemental Table S1.

