
Figure 1.
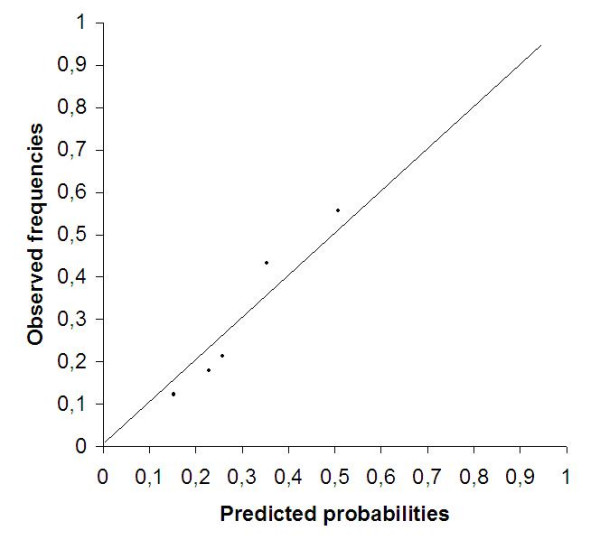
Calibration plot showing the observed probability versus the predicted probability for sick leave in workers with shoulder pain during 6 months following first consultation.
Official websites use .gov
A
.gov website belongs to an official
government organization in the United States.
Secure .gov websites use HTTPS
A lock (
) or https:// means you've safely
connected to the .gov website. Share sensitive
information only on official, secure websites.
Calibration plot showing the observed probability versus the predicted probability for sick leave in workers with shoulder pain during 6 months following first consultation.