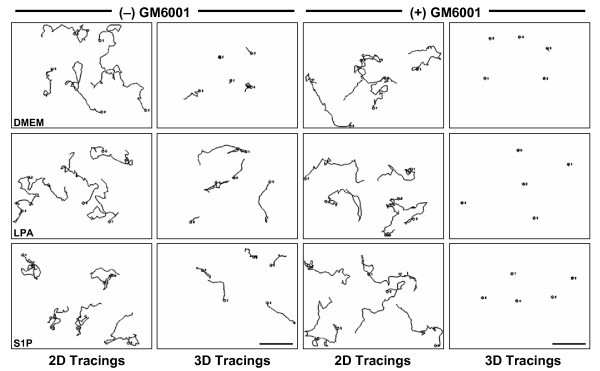
Figure 8.
Lipid agonist-induced tumor cell motility requires MMPs in 3D collagen matrices but not on 2D collagen substrates. Five individual cell tracings generated by Metamorph® (grayscale) in the presence of the specified lipid with or without 5 μM GM6001 (see Table 2 for distance and velocity calculations). Magnification = 20×. Scale bars = 100 μm.

