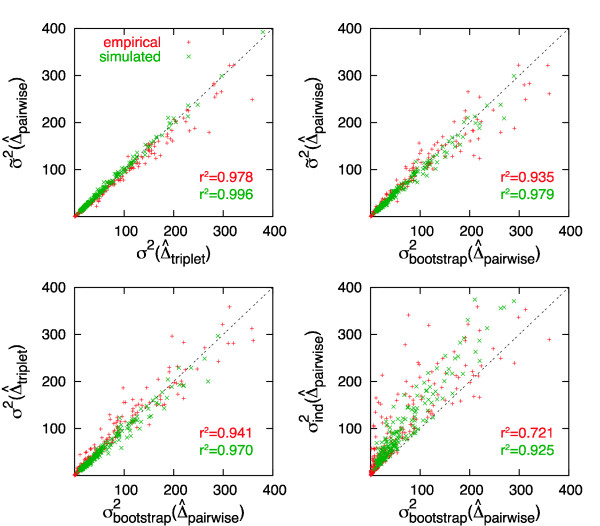
Figure 2.
Scatter plots comparing the variance estimators. The upper-left plot shows the strong agreement between σ2(triplet) and our approximation σ2(pairwise). From the upper-right and the lower-left plots, it can be seen that both have similar correlation with (pairwise). Finally, the lower-right plot confirms that variance estimation under the assumption of independence can yield a large overestimation of the correct variance.

