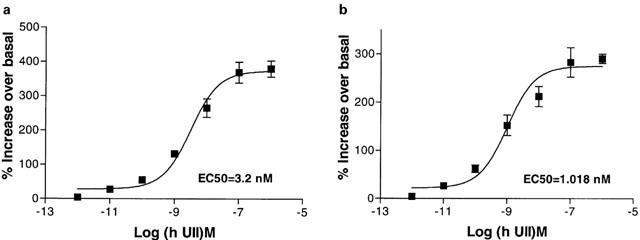
Figure 9.

U-II-mediated [Ca2+]i release. Concentration-response curve for human U-II-mediated [Ca2+]i increase in mouse (a) or monkey (b) UT receptor stably transfected in HEK-293 cells. Each point represents the mean±s.e.mean from three separate experiments.
