
Figure 3.
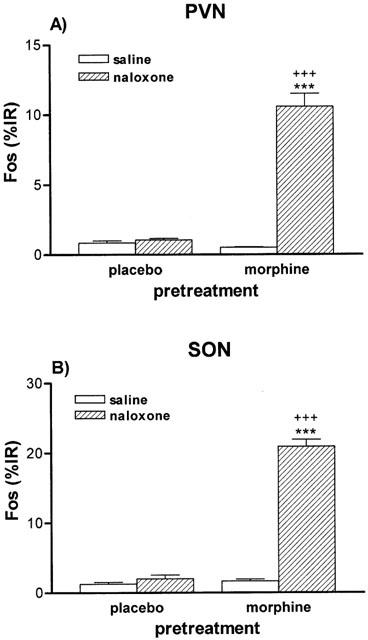
Quantitative analysis of Fos immunoreactivity (IR) in the PVN (A) and SON (B) 90 min after saline (s.c.) or naloxone (s.c.) administration to rats pretreated with placebo or morphine pellets. ***P<0.001 vs morphine+saline; +++P<0.001 versus placebo+naloxone. n=4 – 6 per group.