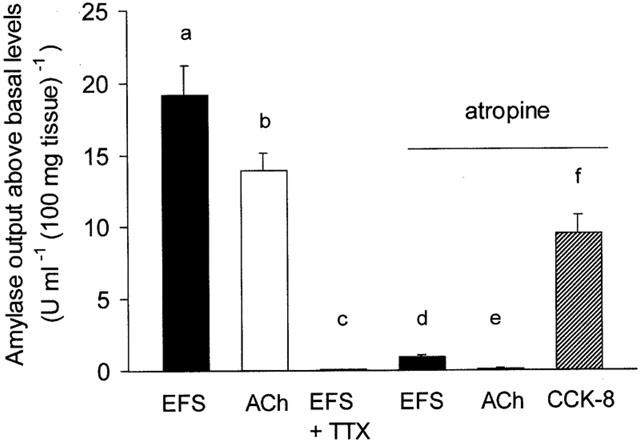
Figure 1.

Characterization of amylase secretory responses to nerve stimulation. The bar chart shows the peak amylase output above basal levels following stimulation with electrical field stimulation (EFS; 10 Hz) alone, ACh (1×10⁻⁵ M) alone, EFS (10 Hz) in the presence of tetrodotoxin (TTX; 1×10⁻⁶ M), and EFS (10 Hz), ACh (1×10⁻⁵ M) and CCK-8 (1×10⁻⁸ M), all in the continuous presence of atropine (1×10⁻⁵ M). The tissue was pretreated with either TTX or atropine for 15 min and subsequently stimulated for 6 min. Values represent means±s.e.mean of 8 – 12 experiments. P<0.005 for (a) compared with (c) and (d), and for (b) compared with (e).
