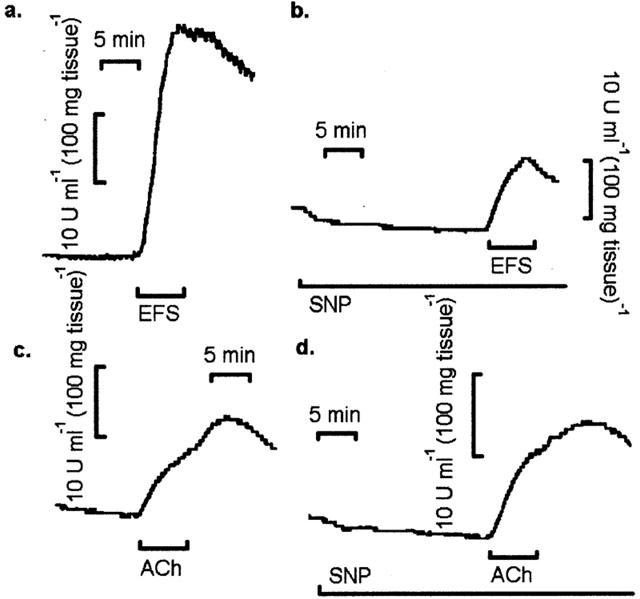
Figure 2.

Effects of SNP on amylase output from rat pancreatic segments in response to EFS and ACh. Original chart recordings of amylase output during (a) EFS (10 Hz), (b) EFS (10 Hz) in the presence of SNP (1×10⁻³ M), (c) ACh (1×10⁻⁵ M) and (d) ACh (1×10⁻⁵ M) in the presence of SNP (1×10⁻³ M). The tissue was pretreated with SNP for 15 min and subsequently stimulated for 6 min with either EFS or ACh. Traces are typical of 10 – 12 such experiments for each application.
