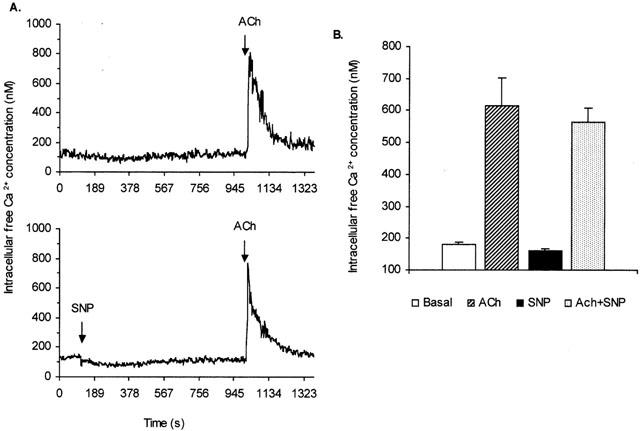
Figure 7.

Effect of SNP on Ca2+ mobilization in isolated pancreatic acinar cells. (A) Original recordings showing the effect of ACh (1×10⁻⁵ M) on intracellular free Ca2+ concentration ([Ca2+]i) in a suspension of fura-2 loaded pancreatic acinar cells in the absence (upper panel) and presence of SNP (1×10⁻³ M, lower panel). The arrows indicate the addition of the drugs. Traces are typical of 8 – 10 such experiments. (B) Bar charts showing [Ca2+]i during basal condition and following the addition of ACh (1×10⁻⁵ M), SNP (1×10⁻³ M) or ACh (1×10⁻⁵ M) in the presence of SNP. Measurements were made at the peak (20 – 25 s) of the response. Each point is mean±s.e.mean (n=8 – 10).
