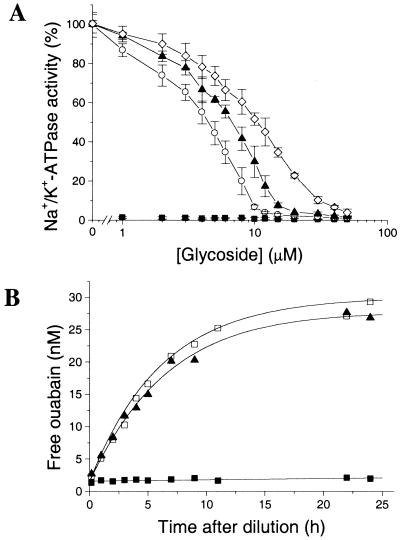
Figure 1.
Binding and activity data for ouabain and its acetonide derivatives in renal Na+/K+-ATPase membranes at 37°C. (A) Dose-response curve showing the ATPase activity remaining at the specified concentrations of ouabain (■), OMA (○), ODA (▴), and OFDA (◊) relative to the total activity in the absence of inhibitors. (B) The time course of release of [3H]ouabain from Na+/K+-ATPase after addition of 50 μM nonlabeled ouabain (□) or ODA (▴) was followed for up to 25 h. The stability of the enzyme-[3H]ouabain complex is also indicated (■).

