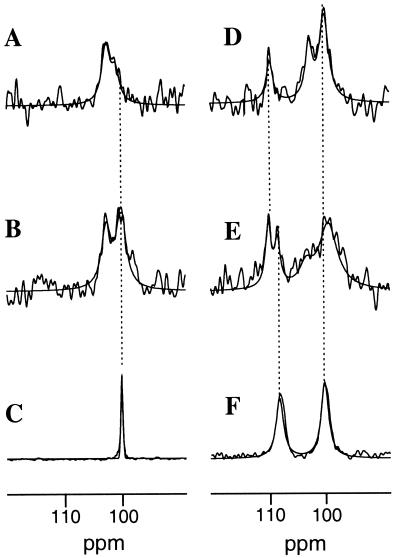
Figure 3.
Region of 13C CP-MAS NMR spectra of renal Na+/K+-ATPase membranes and 13C-labeled ouabain derivatives. Membrane spectra were recorded (at −50°C) in the absence of inhibitors (A) and after addition of [13C]OMA (II) in molar equivalence to the digitalis sites (B), and the spectrum was recorded of II in aqueous solution (C). Spectra also were recorded of membranes after the addition of [rhamnose-13C, steroid-13C]ODA (VI) in molar equivalence (D) and in a 2-fold excess (E) with respect to the digitalis site concentration, and of VI in aqueous solution (F). The dashed lines highlight the chemical shifts of II and VI in solution and II and VI in Na+/K+-ATPase membranes. Spectra resulted from the accumulation of 8192 scans with a repetition rate of 2 s.

