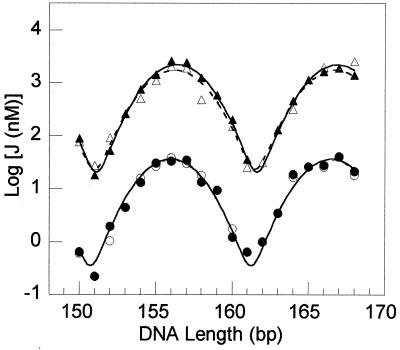
Figure 3.
Comparisons of experimental and theoretical log J versus DNA length for constructs with and without the NPS site. The upper sets of curves correspond to constructs having the NPS site with a fixed linker length of 16 bp. The experimental log10 J values are shown as ▵ and the corresponding curve fit is the dashed line. The simulation values are indicated by ▴ and their curve fit is the solid line. The lower sets of curves correspond to the B-DNA molecules containing a generic 30-bp sequence in place of the NPS site. The experimental log10 J values are the ○ with the dashed line indicating the curve fit; the simulation values are the ● with solid line indicating the curve fit. The data are fitted to double Gaussian equations (25).

