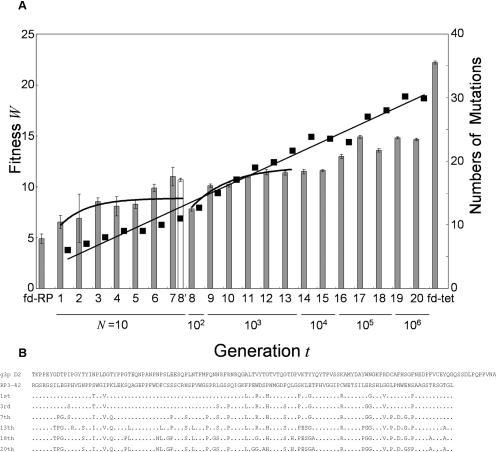
Figure 2. Time Series of Fitness and Amino Acid Sequence in in vitro Evolution.
(A) Each bar represents the fitness of the fittest mutant in each generation. All generations except the 8′th generation, which was derived from the 7th, are of a single lineage. The error bar is the standard deviation for experiments repeated three times. The fd-tet phage is the wild-type, which possesses the native D2 domain. The solid curves through the 1st-8′th and 8th-13th generations are the theoretical curves fitted with Eqn. (13). For each generation, the average of the synonymous mutations between the initial sequence RP3-42 and selected clones at each generation are shown by the filled squares. (B) The whole sequences of the wild-type D2 domain and the initial random sequence are listed. Substitutions accumulated with generations are indicated in single-amino acid code.

