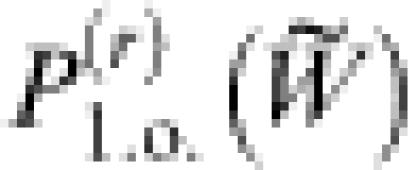
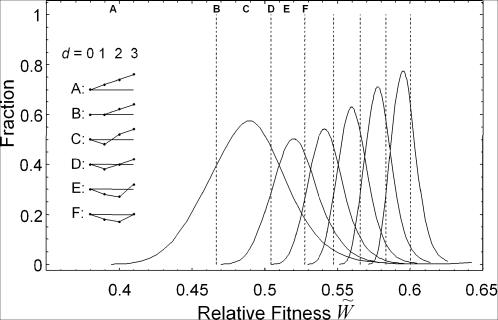
Figure 4. Emergence of Local Optima in the Landscape.
Each Gaussian-like curve represents the fraction of local optima in the r-th order,  (r = 1, 2, 3, 4, 5, 6). Each dashed line represents the relative fitness where the mutation-selection-random drift balance sets in with all conceivable d-fold point mutants of N
(d)
all (d = 1, 2, 3, 4, 5, 6, 7), given by Eqn. (14). The average local structures at different fitness values are shown schematically.

