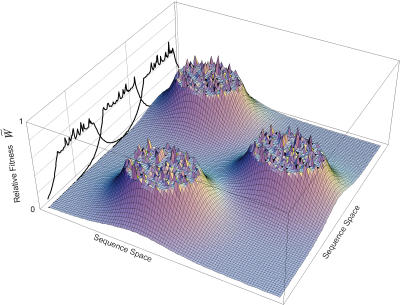
Figure 5. Semi-quantitative Fitness Landscape Plotted from the Experimental Data.
The number of sequences decreases with increasing relative fitness. There are many local peaks at fitness values of ≥0.4. Note that the landscape is not shown over a fitness of 0.6 due to the low frequency of the sequence.

