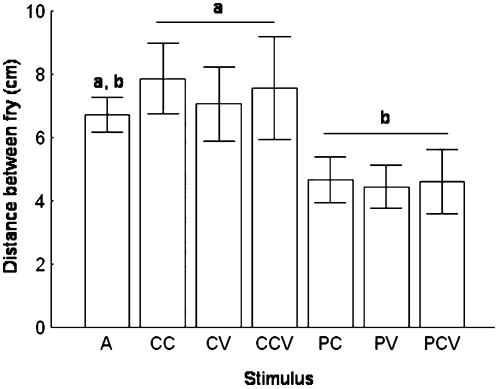
Figure 2.
Mean Distance Between Fry During Trials This figure shows that fry shoal more tightly when presented with predator chemical (PC), predator visual (PV), and simultaneous predator chemical and visual (PCV) stimuli, than when presented with conspecific chemical (CC), conspecific visual (CV), and conspecific chemical and visual (CCV) stimuli. The mean distance between fry during the acclimatization period (A) was intermediate between the mean inter-fry distances during conspecific and predator stimuli trials. Bars and whiskers represent the mean±SE. Means with different letters above them are significantly different (p<0.05).

