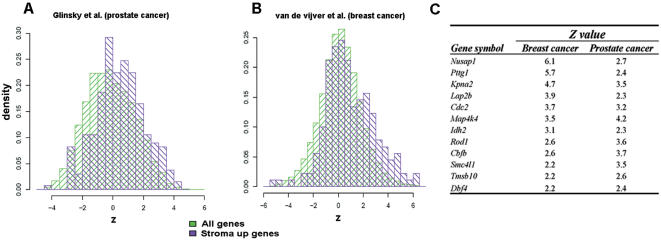
Figure 5. Univariate cox analysis.
Representative histograms of (A) prostate and (B) breast cancer data sets obtained using univariate cox analysis of the correlation between the level of gene expression and survival time.
Histograms show that the distribution of the z variable of “stroma up” genes (purple) is significantly higher than that of all genes present in the chip (green); (C) selected genes obtained by cross-list comparison of Tables S4 and S5 found to have strong predictive value for the survival of breast and prostate cancer patients.
Only genes having a p value<0.05 in both tables were selected.
The z value (and sign) indicate the strength of the correlation between the expression level of a gene and patient survival: the larger the positive value of z the greater the association of the overexpression of the corresponding gene with poor outcome.

