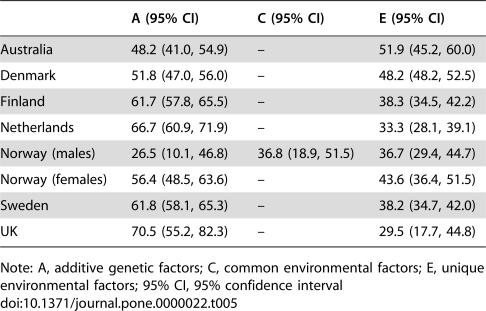
Table 5. Heritability estimates and confidence intervals by country for the most parsimonious model.
| A (95% CI) | C (95% CI) | E (95% CI) | |
| Australia | 48.2 (41.0, 54.9) | – | 51.9 (45.2, 60.0) |
| Denmark | 51.8 (47.0, 56.0) | – | 48.2 (48.2, 52.5) |
| Finland | 61.7 (57.8, 65.5) | – | 38.3 (34.5, 42.2) |
| Netherlands | 66.7 (60.9, 71.9) | – | 33.3 (28.1, 39.1) |
| Norway (males) | 26.5 (10.1, 46.8) | 36.8 (18.9, 51.5) | 36.7 (29.4, 44.7) |
| Norway (females) | 56.4 (48.5, 63.6) | – | 43.6 (36.4, 51.5) |
| Sweden | 61.8 (58.1, 65.3) | – | 38.2 (34.7, 42.0) |
| UK | 70.5 (55.2, 82.3) | – | 29.5 (17.7, 44.8) |
Note: A, additive genetic factors; C, common environmental factors; E, unique environmental factors; 95% CI, 95% confidence interval

