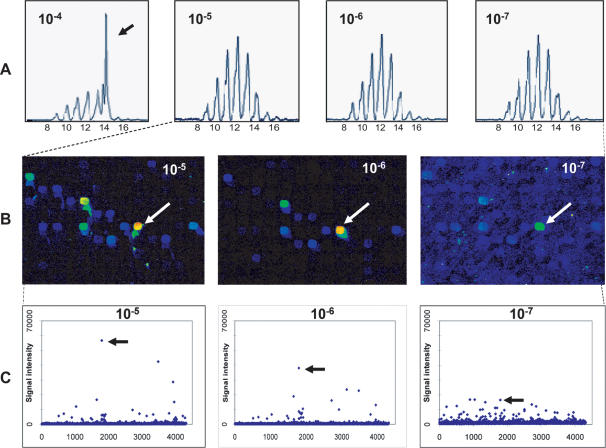
Figure 3. Spectratyping and T-array for Jurkat T-cell clone mixed with peripheral blood CD4+ T-cells.
Jurkat cells were added in different dilutions to a background of peripheral blood CD4+ T-cells.
(panel A) CDR3 spectratyping with Vβ12-specific primer.
The arrow indicates a length identical to 14 amino acids, which is the length of the Jurkat CDR3β.
(panel B) A detail of the T-array scans.
White arrows indicate hexamer sequence GTTCGG, which is complementary to the first six nucleotides Jurkat NDNβ region.
(panel C) Signal intensities of all 4096 spots of the T-array.
Black arrows indicate hexamer sequence GTTCGG.

