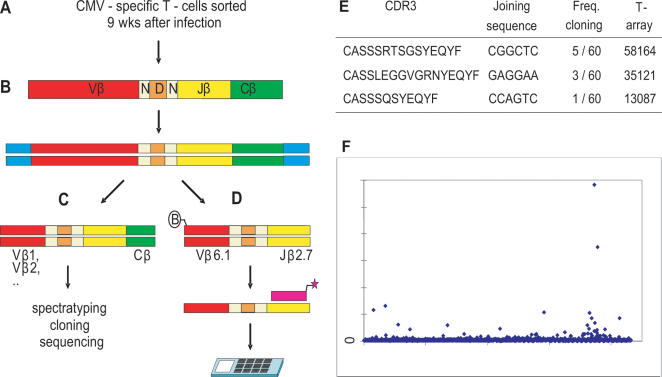
Figure 5. T-array analysis of CMV-specific cells in vivo.
(A) Peripheral blood was drawn 9 weeks after primary CMV infection of a CMV-seronegative renal transplant recipient, and sorted for CMV+ IFNγ-producing T-cells.
(B) cDNA was amplified using anchored PCR (ref. 20).
(C) Vβ's were analyzed by spectratyping and 11 Vβ-families were cloned and sequenced (ref. 18).
(D) The most prominent Vβ/Jβ combination as identified by (C), i.e. the Vβ6.1/Jβ2.7+pool, was amplified by Vβ6.1-and Jβ2.7-primers and loaded on a hexamer array.
(E) CDR3 regions, clonal frequencies, and joining sequences of the identified Vβ6.1/Jβ2.7+T-cell clones.
(F) Vβ6.1/Jβ2.7-specific T-array with the annealer CTACGAGCAGTACTTCGGG, which matches the germline Jβ-2-7 sequence with 3 nucleotides deleted.

